Process capability analysis is a statistical methodology that uses data to determine a process’s capability and performance, specifically its ability to repeatedly produce an output that meets specifications.
The methodology provides a systematic approach when evaluating the performance of a process enabling a better understanding of variability and complying with specifications.
In today’s article, we’ll be looking at process capability analysis; we’ll be covering:
- What is process capability analysis
- Why should we use process capability analysis
- Where is process capability analysis used
- Commonly used process capability indices
- Cp
- Cpk
- PP
- Ppk
- How to carry out process capability analysis
- How to calculate process capability
- How to interpret process capability analysis
- Benefits of process capability analysis
- Issues with process capability analysis
What is process capability analysis?
A significant challenge to many businesses is whether or not they can rely on their processes to consistently produce products that meet specifications and meet quality requirements.
Using tools such as process capability analysis to determine how robust processes are, businesses can de-risk planned production methods and use the results to help make informed judgements that help to drive quality.

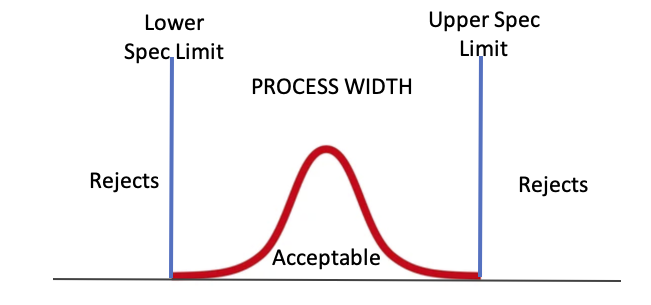
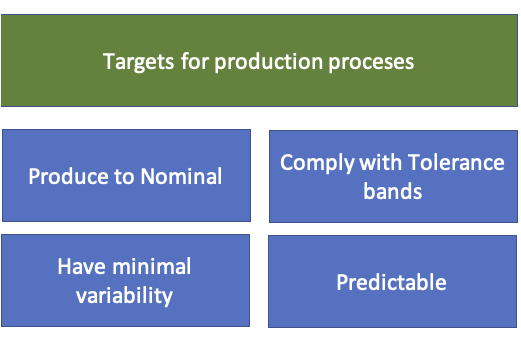
Most organizations want their production process to:
- Produce against nominal requirements,
- Comply with specified upper and lower tolerance bands
- Have minimal variability
- Operate within predictable patterns.
What does this mean? Well, let’s look at an example using a control chart.
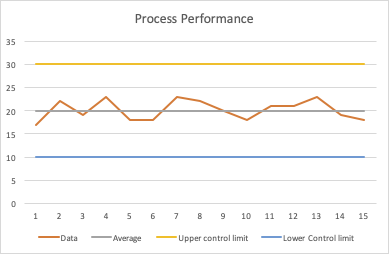
As we can see from this example, production is tightly bound to nominal requirements, it complies with specifications (indicated here with control limits) and has little variability.
Whilst snapshots like this represent an ideal, businesses need methods that can help analyze processes from data sets obtained from production or, through statistics, predict output from a smaller data set (perhaps obtained from prototyping a process).
Process capability analysis has various characteristics, including:
- It requires data in order to calculate capability and process effectiveness
- The larger the data set, the more accurate the results
- It uses statistics to generate analysis
- It measures a process’s ability to produce to a known set of requirements and (upper and lower) control limits
- It compares the spread of the process output to the spread of specification limits
- The information generated can help an organization identify problems and improve performance
- It can be used to predict likely performance
- It can also be used to communicate process performance to stakeholders
Why should we use process capability analysis?
Deploying effective production processes can be costly and challenging.
Ineffective processes can drive cost and impact the customer through poor quality.
The use of statistics and appropriate capability indices offers organizations an effective method to determine process effectiveness and whether these methods can consistently produce goods and services that meet customer needs.
Benefits are provided by assessing process capability & stability:
- Capable – outputs can be predicted to meet specifications.
- Stable – where output is impacted by expected causes of variation
Finally, process capability analysis is widely established and used in a variety of industries, with methods well understood and simple to deploy.
Numerous software packages available can simplify the process, together with training courses that can upskill organizations in its use.
Where is process capability analysis used?
Process capability analysis is widely used across a variety of different industries. These include:
- Manufacturing: where it is used to ensure that products meet customer specifications and requirements.
- Healthcare: where it is used to assess the quality of patient care.
- Financial services: Where it is used to assess and improve the effectiveness of financial processes.
- Service industries: Where it is used to ensure services are delivered effectively.
Commonly used process capability indices
The methodology can use a number of indices, these include:
- Cp: This indices can be used to measure the potential capability of a process. In practice, we can use these indices to articulate if a process can produce products within the upper and lower limits of specifications set by the requirements.
- Cpk: This assesses the capability to produce products within the upper and lower specification limits if it were stable.
- Pp: Pp is a measure of process performance measuring output which is within the confines of upper and lower limits of specification.
- Ppk: The measure of actual performance against the process specifications
Each indices lends itself for use depending on certain situations which can be summarised as:
CP or CPK: If you have a small quantity or sample of data related the process and want to ascertain whether a process may meet customer requirements.
Pp or Ppk: If you have a large quantity of data (i.e total output over a given duration) and are testing an existing process’s performance.
How to carry out process capability analysis
Process capability analysis is a 4 step process:
- Define or select the process you’re going to analyze
- Collect data pertaining to the process – this will include output and control
- Calculate process capability indices as required
- Assess results
Various tools can be used to support step 3 from Excel to bespoke software packages and/or excel plugins that you can also use; many come with reporting / graphing features. If you’re going to be carrying out the activity regularly, you may want to research these.
How to calculate process capability
Undertaking process capability analysis will require a dataset relating to the process you’re looking to analyze, the more data points you have, the more accurate your results are likely to be
How to calculate CP
We calculate CP using the following formula.
CP = (USL – LSL) / (6 * Standard Deviation)
where:
- USL is the upper specification limit
- LSL is the lower specification limit
How to calculate CPK
CPK = min((USL – μ) / 3σ, (μ – LSL) / 3σ)
Where:
- USL is the upper specification limit
- LSL is the lower specification limit
- μ is the process mean
- σ is the process standard deviation
How to calculate PP
PP= (USL – LSL) / (6 x standard deviation)
where:
- USL is the upper specification limit
- LSL is the lower specification limit
How to calculate PPK
PPK = min((USL – μ) / 3σ, (μ – LSL) / 3σ, (T – μ) / 3σ)
where:
- USL is the upper specification limit
- LSL is the lower specification limit
- T is the process target value
- μ is the process mean
- σ is the process standard deviation
How to interpret process capability analysis
In summary, we want a process that is compliant with the specification limits, and this means we want our CP/CPK to be high; if it’s 1 or >1 then it is indicative that the process is compliant.
Results may, however, vary, and we may see a number of different results, including:
- CP>1 & CPK > 1 Process will deliver within specification limits
- CP=CKP process is centred between tolerance limits
- CP > CPK – the process is demonstrably skewed from centre
- CP /CPK significantly greater than Pp/Ppk shows that the process is unstable.
Benefits of process capability analysis
There are numerous benefits of using process capability analysis when analyzing your processes -these include:
- It provides data-led statistical analysis of the effectiveness of processes
- It helps understand whether your processes are effective
- It can support improvement processes such as reducing variability
- It can help aid in improving quality by ensuring processes meet the needs of customers
Issues with process capability analysis
There are some issues to be aware of when using the method – these include:
- Insufficient data used when undertaking the analysis may incorrectly skew the result
- Incorrect assumptions of what constitutes a normal distribution
- Misunderstanding of how to apply the method
- Misinterpreting the results
- Results do not meet leadership expectations and are ignored
Summary
When developing and improving processes, businesses need methods to determine their likely effectiveness.
Using data-driven statistical analysis, processes can be assessed to ascertain capability (specifically how they meet customer requirements and their levels of variability).
The results obtained can be used in decision-making and improvement activities.
By utilizing a well-established statistical tool such as Process Capability Analysis, businesses have a relatively straightforward process they can rapidly implement (if they have the data).
They can use indices (such as Cpk, Ppk) and combine actual and/or predicted output against customer requirements to measure effectiveness.
Process capability analysis is a powerful tool but requires data in order to provide worthwhile results and also an understanding of the method’s limitations.
Many businesses looking to use this tool may face difficulty obtaining sufficient and accurate information. It’s important to recognize that results may vary where this is the case.
Do you use Process Capability Analysis in your business? As ever, we’d love some feedback; how do you use your results? What positives do you take from the process? What issues have you faced? We’d love to hear from you. You can reach out to us via Twitter or by using the comments section below.