A time value map is a graphical or chart-based tool that describes a process, characterizing how it is built up from steps that do or do not add value.
The resultant “map” allows us to assess a process and, through continuous improvement activity, highlight areas that may be evaluated and enhanced to increase value add.
In today’s article, we’ll be covering Time Value Maps; we’ll be looking at the following:
- What is a time value map
- Why use a time value map
- How to create a time value map
- Who uses a time value map
- Benefits of a time value map
- Issues of a time value map
What is a time value map?
As we know, processes are built up from a series of activities.
- Non-value add – steps that don’t add value to the customer, like searching for some information required by a process.
- Value add – steps that do add value to the customer, i.e. undertaking an activity that meets a customer requirement.
- Non-value add but necessary – steps which are required but do not add value to the customer.
A time value map is a method that we can use to articulate the process steps in a way that graphically displays the value add the status of each step.
We would use a time value map when we are
- trying to gain insight into how a process is executed
- Assessing areas where we can undertake improvements
You are probably aware of how we might assess a process using tools like value stream maps that build a view of a process articulating elements of value.
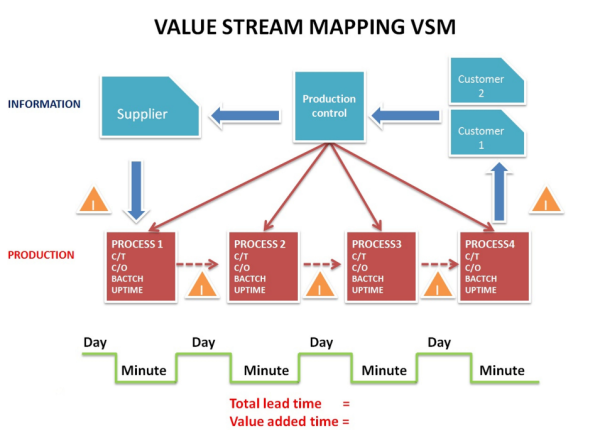
Similarly, Time Value Maps provide a pictorial method of displaying a process.
There are several methods of producing time value maps, from the simple mechanism of merely recording the process steps and their “value status” to processing time which enables you to accurately describe the time taken for the process and the relevant time on the process where value is added.
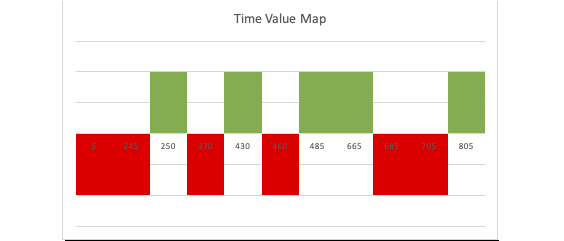
We can see an example Time value map below:
We might also choose to display process steps with the map.
The tool has a few small concepts, so it is relatively simple to train staff in its use, which can empower teams to assess their own processes as part of continuous improvement activities.
Why use a Time Value Map
Continuous improvement is about empowering teams to drive efficiency and effectiveness in their processes, maximizing the value delivered to the customer.
An intrinsic step in this activity is gaining an understanding of the processes being executed.
Time value maps have several uses
- They are a way of capturing steps of a process
- They can be used to analyze processes
- They can aid communication about processes
- They are an aid to continuous improvement
Time value maps are an easy-to-learn, easy-to-use tool for assessing processes.
We typically see them used when an organization wants to assess how much waste a process contains.
We use the tool to capture how much waste is within the process.
The tool is one primarily of analysis; it does not describe how non-value add steps can be eradicated or improved.
With the results, we can assess how long it takes to complete the process and how much of this time is spent on tasks that don’t add value.
As a precursor to producing the chart, there is an expectation that the process has been reviewed and appropriate information captured.
There is also an assumption that the individual capturing the process is able to discern what steps add value and which don’t.
How to create a time value map
Time value maps are not particularly difficult to create, and you can produce them manually. Still, it’s probably more efficient to produce them using a spreadsheet with graphing capabilities, such as Microsoft Excel.
Before you start the process, you’ll need some data; this should include:
- The steps of the process you are analyzing
- An assessment of whether or not value is added
- Time taken for each step (this can be broken down into touch time and waiting time if preferred)
Value add can be defined as something that adds benefit to the customer.
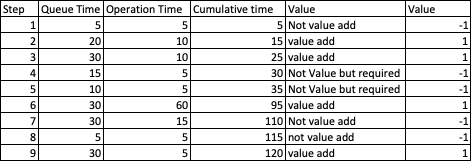
We can assess the status of value add in three ways
1) Step adds value
2) Step does not add value
3) Step does not add value but is necessary
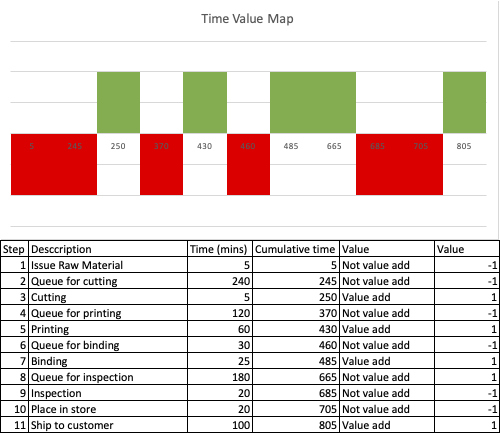
An example data set may look like this.
Once we have collected our data, we can then graph it.
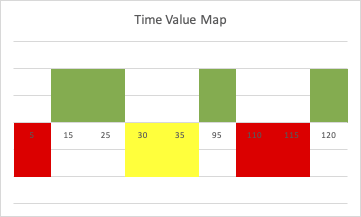
A time value map will use colours to display the data; typically, this is as follows:
- Green – Value add time
- Essential non-value add
- Red – Non-value add
Our final Time Value Map would be displayed as below:
Who uses a time value map?
Capturing, analyzing and improving processes is often thought of as the arena of quality professionals.
Rather we quality professionals know our actual task is, in support of continuous improvement, equip the organization with tools the organization can use to assess and improve end-to-end processes throughout the whole organization.
As a result, users of time value maps tend to fall into one of three camps:
- The Quality function when reviewing/assessing processes or training users
- Dedicated continuous improvement teams in assessing processes
- Leadership who may be interested in the results.
One of the benefits of the simplicity of a Time Value Map is that it is a relatively straightforward tool to roll out to the organization.
As a result, the tool has benefits in the hands of anyone who understands the basic concepts of taking a process, breaking it down into its steps and then quantifying the value of those steps.
You’ll often see time value maps promulgated through the organization as part of a continuous improvement toolkit.
Obviously, we, and our leadership, will also be interested in the results, so while senior leaders may not be aware of the process, they will need an understanding of how they can interpret results.
Clearly, there is a potentially wide user base for this tool.
Benefits of a time value map
There are various benefits of utilizing a time value map. These include:
- Simplicity of use
- A structured approach to assessing processes
- Specifically helps to calculate % of non-value add activity within a process
- Results easy to understand
- It can be used to improve a process
Issues of a time value map
There are several common issues when looking to use a time value map; these include:
- Results may be incorrect if the process has been mapped incorrectly
- Does not highlight the ease of change, only the issue
- Acts as a reporting tool only do not execute change
- The expectation is that people are trained properly in its use
- Results obtained but then aren’t acted upon
Summary
A time value map is a simple but effective element of a continuous improvement toolkit.
It can help an organization build up a view of its processes and, in turn, highlight areas of waste.
They are simple to use, and the whole organization can be trained in their use.
The results obtained are simple to interpret and can then feed further actions to drive improvement.
Have you used a time value map? How was your experience? As ever, we’d love your feedback. You can reach us on Twitter or via the comments section below.