Visual problem-solving is a method where an individual or team uses visual tools such as charts, indicators, diagrams, infographics, and pictures as an integrated part of the problem-solving process to both understand and generate solutions to given problems.
Visual problem-solving has several characteristics, including simplifying complex issues and lends itself to use in business when practised correctly. It has key dependencies, such as access to information.
Problem-solving is a key skill, whether in business or one’s personal life. Selecting and utilizing an appropriate and effective method to support the problem solver is essential.
Visual problem-solving provides a toolset that extends beyond the traditional methods of solutionizing and can help accelerate the process.
In today’s article, we’ll be covering visual problem-solving we’ll be looking to cover:
- What is visual problem solving
- Visual problem solving and the Problem-solving process
- Visual Management as a problem-solving aid.
- Why use visual problem skills
- Information and Visual problem solving
- Visual Problem-solving skills
- Problem-solving in a visual domain
- Benefits of visual problem solving
- Issues with visual problem solving
What is visual problem solving
Problem-solving is a required skill, whether in business or our personal lives.
Problem-solving involves taking a particular situation where the status is worse than planned and returning it to the state it should be (or improving it).
We are faced with issues and problems daily, problems that require investigation and resolution, some more important than others, some with higher impacts than others.
To solve problems effectively, we require systems and processes that help support both understanding the issue and root causes, together with developing viable solutions.
In business, assessing, diagnosing and resolving problems is a key enabler of competitiveness.
The types of problems that a business might experience are varied and potentially complex; they might include the following:
- A downturn in customer perception of your business,
- Rapidly increasing costs
- Reduced output vs plan
- Absenteeism and reduced staffing levels
- Safety issues
- Decreasing quality of products
- New entrants into the market that take market share
- System Security
There are a variety of problem-solving methods that we can deploy. Of key importance is that they are the:
- Rapid
- Simple
- Effective
Visual problem-solving has several characteristics that lend it to being deployed:
- It uses imagery/tools to simplify complexity.
- Imagery can be used in any stage of the problem-solving process.
- It can be used by an individual or group.
- It is more appropriate for some types of problems than others.
- It’s a learned skill that a user can become more proficient in through repetition and practice (where visualization used is consistent)
- In some industries, visualization is integrated into the process.
But what do we mean when we use the term visual? What we mean is an artefact, a visual representation relating to the problem being experienced, this could be varied, and examples include:
- A chart
- A mindmap
- An infographic
- A process map or workflow
- Drawings
- A graphical alert on a computer system
- A whiteboard
- Picture
- Maps
- Icons
- RAG status
We can use a mix of these in a number of ways at each stage of the problem-solving process, for example:
What is the problem? – Graphs, Traffic lights, alerts/icons, RAG Status
What is the impact? – Charts/Graphs
Where is the problem happening? – Maps, Venn diagrams, charts
Why is the problem happening? – Flowcharts, Process maps, diagrams, pictures
When did the problem occur? – Timelines, flowcharts
What is the solution? – Whiteboards, process maps, flow charts, graphs
What is the outcome? – Graphs, charts, icons
Visuals help us present the problem, highlight relationships between influences and articulate why things are happening.
They are effective because the brain sees the images and then translates them within the context of what’s being described enabling us to assimilate complex information at pace.
Visual Problem-solving can be used as a stand-alone methodology or in combination with other methods.
Certain visuals may be better suited to solving particular problems than others.
So, how might we utilize visual problem-solving? Let’s use the example of increased costs.
In this example, we might be faced with numerous methods. We are likely to also be faced with moderate to large sizes of data that will require investigation if we are to ascertain the root cause and deploy appropriate mitigation.
We are faced with two methods:
- Manually analyzing large volumes of data from our financial system.
- Summarising views (perhaps multiple) of financial data, representing costs using visuals which may help Pareto expenditure and help point at root causes
Manually analysing large amounts of information/data is clearly complex and time-consuming.

In this example, a simple Pareto chart of expenditure helps us understand part of the cause, but we then need to dig deeper to get to the root cause.
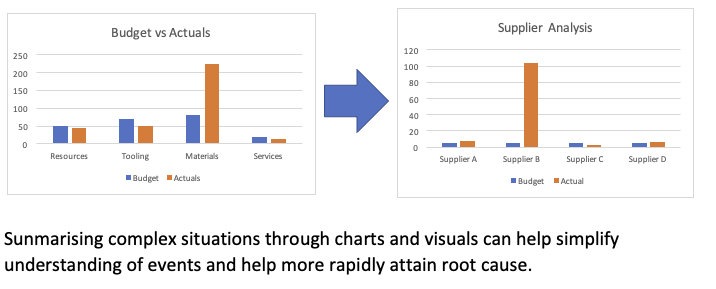
We can see that the organization buys the same raw material from several suppliers, one of which has increased its price.
In this simple process, we have simplified a complex problem through the use of visual tools (graphs and charts) that we have used to interpret the situation and develop potential solutions.
Importantly, despite using a potentially effective solution, we still need to understand the context of the problem with some knowledge of the business and its activities.
Visual problem solving and the Problem-solving process
Problem-solving requires a series of steps to be executed in order to understand events leading to current status and develop interventions to correct them.
While there are several variations, most problem-solving is built around some common steps.
- Define the Problem
- Define the goal
- Identify the Root Cause
- Develop & execute an action plan
- Evaluate the Results.
We could look to implement some of these steps into our management review processes so we can apply review and corrective actions as a matter of course, but can we learn anything from industry on how we can apply visual problem-solving more tightly into our processes?
A further example of how visual problem-solving is used, this time in real-time, is in the role of the air traffic controller.
Air traffic controllers utilize inputs from visual displays (be that from radar, positioning, route overlays etc.)and direct interface with pilots.
These data-driven interfaces not only provide information on the status of air traffic but provide real-time information, which can be interpreted, allowing air traffic controllers to assess problems as they arise and make rapid decisions to remedy the situation.

Clearly, air traffic controllers require a significant deal of domain knowledge (they are, after all, securing people’s lives). This is a further example of how training can help develop people’s ability to interpret simple, contextual information in problem-solving.
Air Traffic control, as you’d expect, is highly complex. How might we utilize these methods in a simpler situation?
The most obvious is that we can apply visual management in the workplace, which can present real-time (or near real-time) information as problems emerge to drive decision-making.
Visual Management as a problem-solving aid.
Let’s consider a modern manufacturing facility with day boards. Shadow boards, alerts and a variety of data displays all of these provide inputs to make real-time decisions in order to drive output to the required standard.
Such systems can be simple, however, in more complex situations, data can appear from various diverse systems, and there is a clear dependency on clean data in order to enable correct decisions.
With some thought, methods such as these can be applied across business functions.
Ultimately, however the problem is visually presented, there is a requirement for the individual or team to mentally assess and resolve it, especially where the problems have high levels of complexity.
So tools to support reasoning only help in the process of understanding and determining route cause and possible corrective action; they do not remove the requirement for a level of reasoning completely.
Indeed, without the proper context, incorrect mitigation may be deployed, which might cause further issues.
Implementation of corrective action also requires a degree of planning and execution that probably benefits from other appropriate tools.
Why use visual problem solving
As we discussed in our introduction, problem-solving is one of the more common skills that you’ll utilize in life and business and being adept at analyzing situations that have deviated from the state they should be to one that is underperforming and then developing a logical resolution is a common feature of most day to day’s life.
Given that there are numerous problem-solving skills, why should you use visual problems solving?
That is probably an inappropriate question, and you should ask yourself which problem-solving technique suits the situation you find yourself in.
Visual problem-solving does have some specific characteristics, such as:
- It can facilitate rapid decision-making based on the interpretation of visual indicators.
- It can simplify complex situations.
- Inputs/Events can be displayed in numerous ways and tuned to specific audiences.
- If a business adopts common ways of displaying information, then users can be trained easily and can become more proficient through further exposure to methodology.
Utilizing common methods of presenting information is something to explore further.
There are ways that businesses can use common methods of displaying information throughout the business; this can help not only with interpretation but allow everyone within the business to participate by using a common set of indicators.
I personally believe that in utilizing visual-problem solving methods, barriers can be broken down through simplification, allowing for teams to collaborate on the process, in particular, the ability to outsource elements to 3rd parties (sometimes in real-time).
Once the indicators have been established together with rules around interpretation and prioritization, then it becomes easy to share information.
Information and Visual problem solving
A key dependency of visual problem-solving is information. Information that can be summarised and visually presented (You can’t chart information if you don’t have the data to begin).
Successful results clearly require not only on presentation but the robustness of the data.
It goes without saying that many organizations find obtaining clean and reliable information for decision-making challenging.
Once they have it choosing an appropriate way of displaying it is another challenge!
Businesses and individuals should consider the use of visual problem-solving carefully if they are likely to face major challenges in obtaining data/information that will be used in the process.
Challenges might include
- Data can’t be obtained
- The data is not clean and has errors
- Disparate data sets cannot be related in a way to make visual problem-solving viable
- Low levels of understanding of what the data represents.
- Incorrect visual methods are used and do not simplify the process.
Visual Problem-solving skills
Problem-solving as a process is still universal and relies on the traditional well-established step-by-step process.
Utilizing visual problem-solving does not replace problem-solving skills per se but does necessitate several skills that, whilst not necessarily unique, are worth bearing in mind.
These skills include:
- Ability to follow a standard step-by-step process
- Ability to select data and appropriate visual indicators that support the methodology
- Ability to Interpret indicators
- Ability to prioritize actions based on indicators (and triage where necessary)
- Ability to analyze data sets (sometimes disconnected data sets)
- Ability to select appropriate graphical representations for use in problem-solving
- Ability to model what-if scenarios
Visual Problem solving does assume reliance on information, and while there is no implied link between data analysis and presentation, for many, they will be involved in both ends of the process, both gathering data and presenting it in a format that can be used in a problem-solving situation.
Problem-solving in a visual domain
In many professions, individuals assess complex situations and make decisions on the basis of visualizations in the workplace.
We have already discussed air traffic controllers who make decisions based on complex graphical representations of real-time air traffic situations.
Other professions who are required to solve complex problems through visualization include doctors, scientists, soldiers etc.
All will utilize technology to capture and present information using visual stimuli to differentiate performance or situations that are to expectations vs those that aren’t; many may have workflows built around situations that don’t meet expectations allowing users to resolve in real-time.
The complexity of these graphical tools varies, but nevertheless, the process is based on problem-solving principles; the individual is required to read the information being presented, interpret it and consider various decision routes and their outcomes ahead of deciding on an appropriate course of action.
As we see more automation in industry, the ability to incorporate visual problem-solving directly into working routines is becoming more common.
Unsurprisingly as individual expertise grows, the ability to more rapidly choose an outcome and a successful outcome increases.
Benefits of visual problem-solving.
Visual problem-solving can offer many benefits that, include:
- Simplification of the problem-solving process
- Simplication of complex situations
- Rapid resolution of problems (through simplification)
- Use of indicators (colour, shapes etc.) that help triage situations
- Facilitate the wider organization taking part in problem-solving activities
- Can enable outsourcing of optimization activities
Issues with visual problem solving
As we’ve discussed, there are several issues that you’ll want to explore:
- Reliance on data being accurate
- Visualization does not remove the need for contextual understanding
- Visual tools do not mitigate the need for an effective problem-solving process.
- Likely to require a level of user skill
- Setting up infrastructure for real-time visual problem-solving can take time and cost.
Summary
Visual problem-solving offers a part of the problem-solving toolkit (rather than replacing it completely).
The use of Visual Problem-solving shows that given the right situation, businesses have an effective route when solving problems, particularly complex situations which require detailed analysis and summarisation.
The use of visual indicators to help simplify and triage situations can improve the performance of the problem-solving process where it is practical (when considering the dependencies of the method).
There are further advantages that can be obtained when this methodology is built into working processes allowing operators to capture and resolve issues in real time, mitigating the impacts that problems may deliver.
Does your business utilize visual problem-solving? What’s your experience been? Have you seen advantages? As ever, we’d love your contribution to the discussion. You can reach us on Twitter or via the comments section below.