Statistics in Quality refers to widely used methodologies that are employed to capture and analyze data in order to determine aspects such as
- Variability
- Process performance
- Product Quality
- Possible future outcomes or trends
- Improvement opportunities
A variety of statistical methods are commonly used; these include:
- Six Sigma
- Statistical Process control
- Process capability analysis
- Design of experiments
In this article, we’ll be looking at how we utilize statistical methods in Quality; we’ll be covering
- What are statistics in Quality
- Statistical process in Quality Improvement
- What statistical methodologies are used in Quality
- Six Sigma
- Shainin System
- Taguchi’s method of Quality control
- Why use statistics in Quality
- Benefits of using statistics in Quality
- Issues when using statistics in Quality
What are Statistics in Quality?
The use of statistics and mathematical analysis is commonplace within business.
Most need methods of assessing performance and will frequently utilize (sometimes straightforward) statistical analysis methods to do so.
Quality functions typically involve activities such as assurance, control, compliance and improvement and commonly employ statistical methods to execute them.

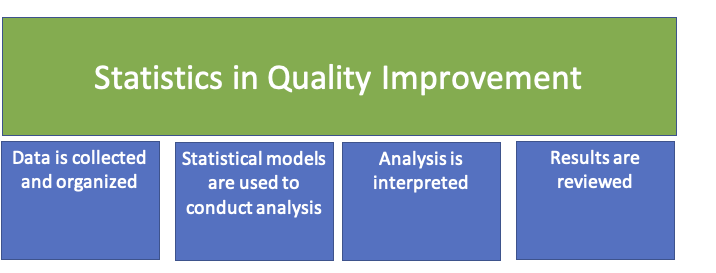
Statistics itself is a field of expertise that centres around the analysis and interpretation of data; it has several main characteristics
- Data is collected and organized
- Statistical models are used to conduct analysis
- Analysis is interpreted
- Results are presented and reviewed
The use of Statistical methods within a business will usually follow certain principles, including:
- Businesses are likely to use commonly adopted industry methodologies.
- These methodologies may be used in isolation or collectively.
- There is a reliance on data.
- Tools / Software are commonplace within the process in order to automate calculations
- Businesses usually have subject matter experts familiar with both methodologies and tools
- Statistical methods are used to analyze data and understand a given situation.
- Results will typically report on deviation against a standard (i.e. assessing potential variability)
- The business will use the results to determine a root cause for deviation from standard and propose action plans
The use of statistics in quality management is seen across a wide range of industries, from manufacturing to service businesses.
While there is a reliance on information to input into the statistical process, many businesses may find challenges. These include:
- Access to data
- Reliability of data
Within the Quality function, we determine levels of quality by determining levels of variability in the inputs, process and output. As quality professionals, we look to reduce variability within our business which in turn improves levels of quality.
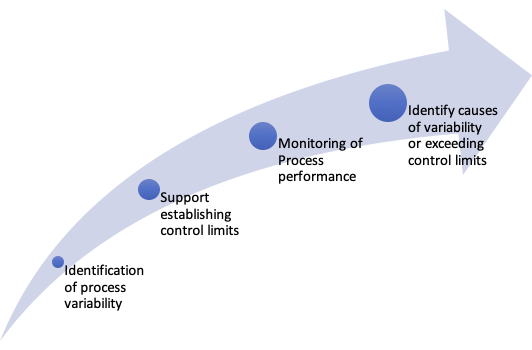
The use of Statistical methods helps us understand (and improve)
- Identification of process variability
- Support establishing control limits
- Monitoring of Process performance
- Identify causes of variability or exceeding control limits
The use of statistics is part of the basic toolset for driving improvements. It has several key aspects
- The methodology used (such as Six Sigma)
- Analysis tools (such as Control charts)
- The choice of metric
The statistical methodology selected by a given business will depend on specific requirements. Many organizations will utilize a standard set of methods that help enable consistency and support training within the business for those who utilize the tools.
Statistical process in Quality Improvement
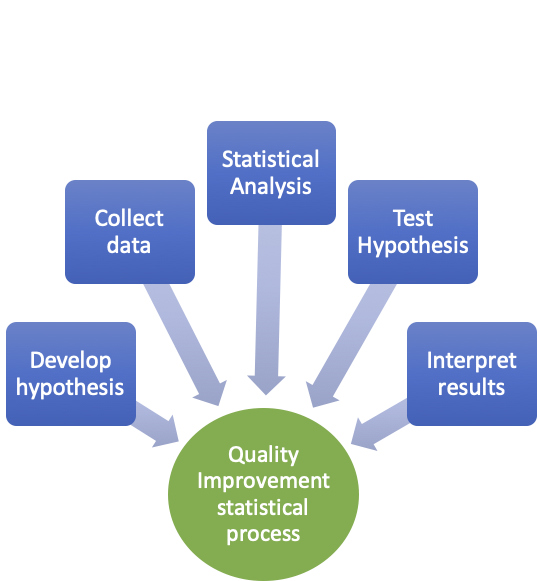
The use of statistics involves a process which typically consists of the following steps:
- Developing a hypothesis
- Collecting data
- Statistical Analysis
- Testing of hypotheses
- Interpretation of results.
Let’s take a look in a bit more detail at the typical steps used in using statistics in Quality.
1/ Developing a hypothesis
A hypothesis is a prediction around a particular issue (including possible relationships pertaining to the current outcome). An example might be, “Implementing new production equipment will reduce nonconforming products by 25%.”
2/ Data collection
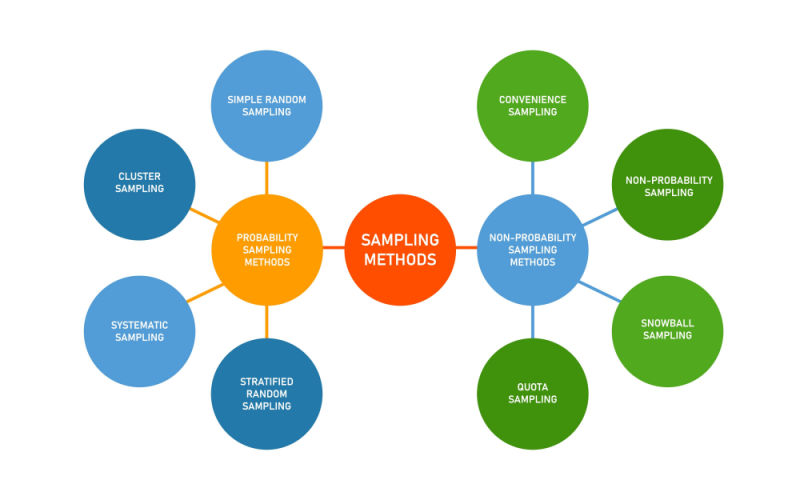
Statistical analysis is dependent on the use of data. Data is typically obtained via sampling methods. The method of Data collection used has pros and cons, and there are several types of sampling which include:
- Random sampling – Obtaining a sample where each of the population has the same chance selection.
- Stratified sampling – Where it is deemed beneficial to sample each strata within a dataset.
- Systematic samples – Data selected according to a predefined sequence
- Non random sampling – Selecting data from a population using a non-random method (e.g. interviewing people in a particular location at the same time).
3/ Use of Statistical models
We use statistical models in order to support analysis and understanding relationships between variables. Appropriate statistical models can help in analysis and predictions. Examples include:
- Linear regression
- Logistic regression
- Kmeans clustering
4/Analysis
Analysis involves a thorough examination of statistical results in order to determine key relationships, dependencies and causes.
5/ Interpretation
Interpretation of analysis within the context of the business, including cause and effect. This step will usually lead to recommendations.
6/ Presentation & Review of results
The final step is to review the results of the statistical analysis and determine the next steps. Leadership are likely to determine the next step and use statistical analysis as part of their reasoning.
What statistical methodologies are used in Quality
Most quality improvement strategies rely strongly on statistical methods. There are a variety of these methods that could be used, but there are common examples within the world of Quality; these are:
Six Sigma
Most of us will be familiar with some form of Six Sigma. Widely used in Quality Management, Six Sigma utilizes decision-making processes underpinned by data and statistical techniques. These statistical tools and techniques can include
- SPC – STatistical process control
- Design for experiments
- Control charts
- Distribution charts
- Inference statistics
There have been many studies around the benefits that Six Sigma can bring to an organization, from reduced costs to improved Quality.
Shainin System
Developed by Dorian Shainin, the Shainin system is a statistical methodology often used in high-volume businesses with easy access to data. Central to the system are beliefs that there are major or “dominant” causes of variance and a belief that resolving variability is a journey of diagnosis through the use of appropriate statistical tools and improvement. By focusing on dominant causes, users of the Shainen system bypass brainstorming activities (such as fishbone diagrams) and focus on key contributory causes.
Taguchi’s method of Quality control
Developed by Genichi Taguchi, this method of statistical quality control follows an approach where key factors that affect product quality are investigated. Experiments are developed, and the results are assessed in order to ascertain methods of optimizing these factors to result in the preferred levels of Quality.
This Taguchi method is commonly utilized in large-volume manufacturing.
Why use Statistics in Quality
When faced with challenges within business, we expect the Problem-solving methods to have several characteristics:
- Efficiency in developing resolution
- Accuracy
- Actions that result in desired change
- A process that is repeatable
Statistical techniques meet each of these, providing both objective and unbiased results in complex situations.
Further, they aid us by removing ambiguity through tried and tested methods of analysis.
One of the key failings of many problem-solving activities is that subjective assumptions take over, and both time and cost are sunk into chasing after something that won’t deliver the required outcome.
Through the use of Statistics, this is mitigated by basing outputs and predictions on objective data providing both reliable and unbiased results.
Principally we use statistics because it provides a repeatable process that helps:
- Highlight areas of variability
- Identify underlying causes of variability (or highlight areas where a business may improve)
- Determine if the parameters we have set are valid
- Identify root causes for variability
- Test hypothesis (or predict trends)
- Provide tools that simplify the analysis of large complex data sets
The use of statistics provides a route to doing this that is, in practice, well-understood and relatively easily deployable. Its widespread use means that results are recognizable for those in Leadership roles and methods are trusted.
Benefits of using statistics in Quality
We’ve described various aspects of the use of statistics in a quality environment and the benefits this brings, this includes:
- A Repeatable and trusted process
- Widely used tools and techniques
- Its use helps removes subjectivity
- Results can be assessed and acted upon by the business
- Helps remove complexity or analyze large, sophisticated data sets
Issues when using statistics in Quality
As with any system, there are issues to consider; these include:
- Potential for using incorrect sampling methods that drive incorrect analysis
- Subjectivity is not completely removed, and personal bias may remain, driving incorrect assumptions
- Misinterpretation of results
- Believed complexity of the process, so the use of statistical methods is avoided
- Lack of tools or domain knowledge within the organization
- Available data is poor and may produce inconclusive or incorrect results
Summary
Statistical methods are an important element in our Quality toolkit; they can help us identify variation within our processes and outputs.
They are widely applicable to many industrial sectors and are widely used within them, with statistics having a quantifiable pedigree in delivering benefits.
Due to widespread use, there are a large variety of commercial tools and software packages that help exploit the use of statistics in your business.
For most of us, statistics remains a powerful tool that we regularly use to drive improvement.
Through its use, we can gain important insight into our processes and make informed decisions regarding change. As such, it remains a key business tool.
How do you use statistical methods and models in your day-to-day activity? As ever, we’d love to hear from you, and you reach us on Twitter or via the comments section below.