Visual Management is a methodology used by businesses with the goal of improving communication, organization, safety and efficiency by using visual indicators and easy-to-understand cues which provide relevant and contextual information to employees and stakeholders about business activities.
There are various types of visual management systems, each with particular pros and cons. When implementing a particular solution, organizational goals should be considered along with advantages and disadvantages of the chosen solution in order to achieve an effective implementation.
In today’s article, we’ll be investigating types of visual management; we’ll be covering:
- What is visual Management
- Types of Visual Management
- Visual Management Examples
- Why do businesses implement Visual Management
- How do you choose which type of Visual Management to implement
- How do you implement Visual Management?
- What are the common issues with Visual Management
What is Visual Management?
Visual Management is a methodology of using visual aids and cues to provide useful and contextual information (often around complex subjects) to the workforce and stakeholders. Types of visuals include signs, charts, diagrams, and images.
The objective of using this methodology is to inform workers and improve understanding of aspects such as performance, status, and progress, helping to make the organization more effective through fact based decision-making, communication, and problem-solving.
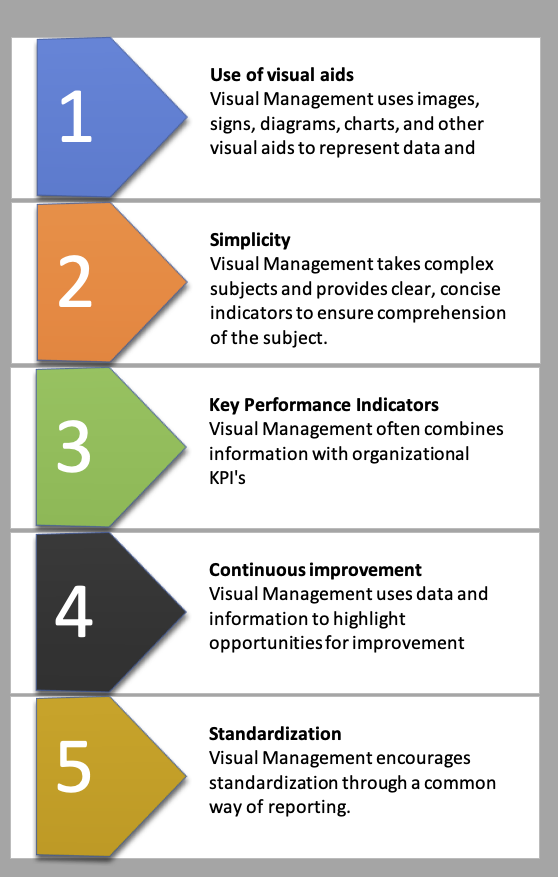
Visual Management has several characteristics, including:
- Use of visual aids: Visual Management uses images, signs, diagrams, charts, and other visual aids to represent data and information.
- Simplicity: Visual Management takes complex subjects and provides clear, concise indicators to ensure comprehension of the subject.
- It relies on data or information to communicate
- Key Performance Indicators: Visual Management often combines information with organizational KPIs
- Continuous improvement: Visual Management can highlight opportunities for improvement
- Standardization: Visual Management encourages standardization through a common way of sharing information
- Effective Visual Management requires careful planning and implementation in order to be effective.
- Visual Management is an ongoing process that requires regular review and sustainment.
Visual Management is a mature methodology that has been used in manufacturing and service organizations for many years and is a key element of many improvement methodologies, such as the lean production system.
Types of Visual Management
If you walk into any business, the chances are you’ll be bombarded with visual management examples. From signs, posters, labels, charts and indicators, you’ll see them spread far and wide.
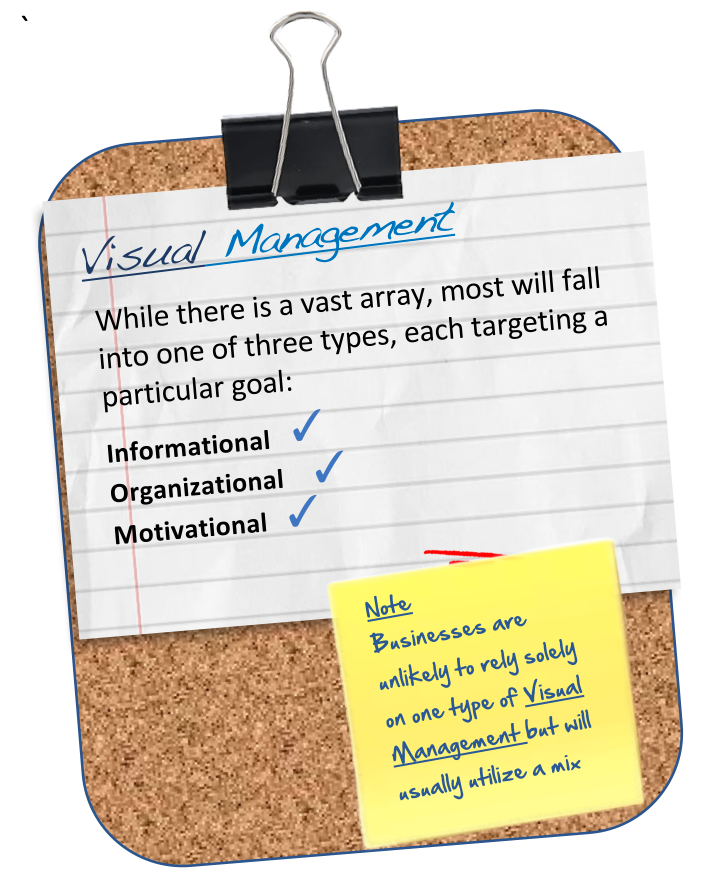
While there is a vast array, most will fall into one of three types, each targeting a particular goal:
- Informational – Provides clear and concise information to workers. Examples include Signs, diagrams, and labels. Informational visual Management helps to reduce errors, improve safety, and increase efficiency.
- Organizational – helps workers understand how their work fits into the larger context of the organization. Examples of this type of visual Management include flowcharts, value stream maps, and process diagrams.
- Motivational – designed to inspire and motivate workers to achieve their goals. Examples of this type of visual Management include goal charts, recognition boards, and performance metrics.
Businesses are unlikely to rely solely on one type of visual Management but will usually utilize a mix, typically using the type that is appropriate and effective (and will garner the most benefit) in the area that it’s being deployed.
Visual Management Examples
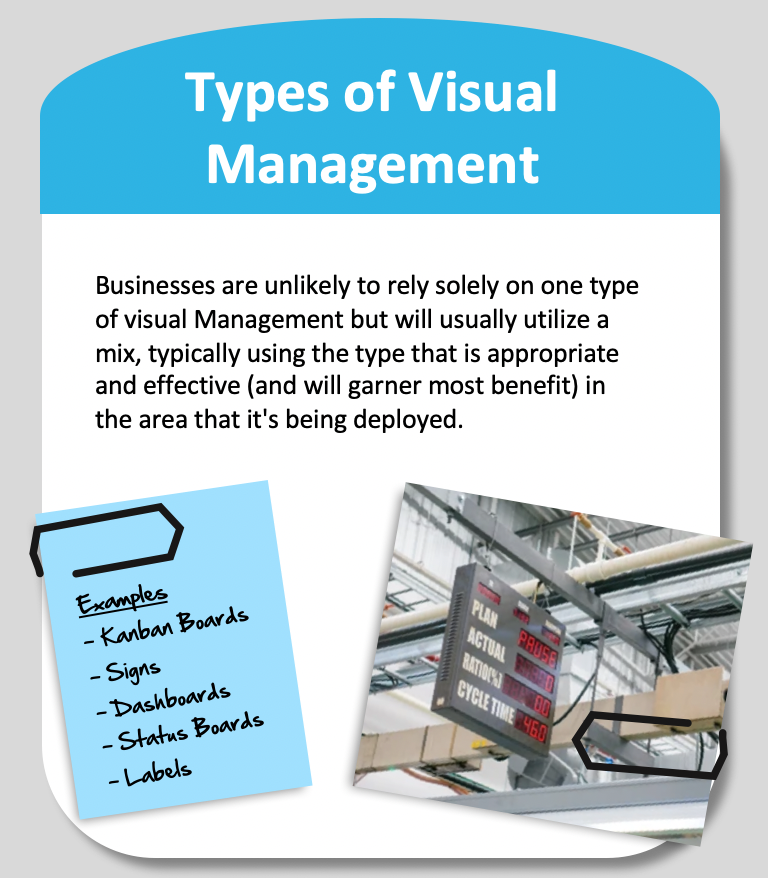
Kanban boards:
Used to manage and track work progress and flow.
Pros:
- Provides a clear visual representation of work status and progress.
- Helps teams prioritize tasks and focus on completing the most important work.
- Supports continuous improvement
Cons:
- It can become complex if too many tasks appear on the board.
- Requires sustainment to be effective
- Reliant on upto date accurate information
Used in: Kanban boards can be implemented in a variety of businesses, including manufacturing, software development and service industries.
Andon or Status boards
Shows real-time production status, highlighting issues that may need immediate attention
Pros:
- Provides real-time information on production status. Facilitates quick response when issues occur
- It helps teams work together towards a common goal.
- Can support continuous improvement
Cons:
- It can become distracting if there are too many alerts or notifications.
- It can be costly to implement.
Industries used: Commonly used in manufacturing environments, particularly in lean production systems.
Process maps:
A visual representation of the steps involved in a process
Pros:
- It helps teams visualize the steps involved in a process.
- Highlights areas for improvement and opportunities to streamline processes, such as process bottlenecks.
- Can facilitate standardization of processes
- Helps make people aware of their role
Cons:
- It can be time-consuming to create.
- It may not account for all possible process variations.
- Requires sustainment as processes evolve
Industries used: Process maps can be implemented in any business where processes are used.
Performance dashboards:
A visual representation of key performance indicators (KPIs) and performance.
Pros:
- Provides an at-a-glance view of status against agreed key performance indicators.
- Facilitates identification of activities that may require attention.
- Drives data-driven decision-making.
Cons:
- Effectiveness is driven by selecting the right metrics
- Metrics may not always provide a complete picture of performance.
- Requires provision of accurate and understood data
Used in industry: Performance dashboards are used in any business where tracking and monitoring of KPIs is essential, from manufacturing to service type business.
Visual communication boards:
Helps teams collaborate by communicating critical information and progress updates.
Pros:
- Provides a clear, concise method to communicate critical information.
- Enhances collaboration and communication.
- Supports teams working towards shared goals.
Cons:
- It can become cluttered and confusing if not maintained regularly.
- It may require time and resources to create and update.
Used in Industry: Visual communication boards can be implemented in any business where effective communication is crucial, such as project management, sales, and customer service.
Why do businesses implement Visual Management?
Visual Management is widespread (try finding a business that doesn’t use it). Companies will usually implement visual Management because they generally want to improve in four key areas:
- Effectiveness: By making critical information easily accessible and facilitating communication and collaboration
- Efficiency: Focusing on critical business actions, removing the need for unnecessary activities
- Reducing errors: Simple visual cues can help create a safer and more reliable workplace
- Improved communication: By providing clear, concise, and easy-to-understand information, communication is improved.
How do you choose which type of visual Management to implement?
Given that there are various types of visual management, selecting what’s appropriate is vitally important to ensure that your organization achieves its goals.
There are several aspects to consider:
- Have well-defined goals: have clear goals and objectives you want to achieve through implementing visual Management. Define what good looks like and how you measure if your use of Visual Management has been a success.
- Consider your audience: Who will be using the visual management information? What information helps them be more effective?
- Benchmark – learn what’s worked elsewhere
- Determine feasibility: Is your plan feasible in terms of implementation and sustainment?
- Consider ease of use: Choose a method of presenting information that is easy to use and understand. This will help drive adoption and engagement from users.
- Test and refine: Test with a small group prior to implementation and refine it based on feedback.
- Monitor and adjust: Monitor the effectiveness of the visual management tool once it’s been deployed and adjust it as necessary to ensure continued success.
How do you implement Visual Management?
Each business applying Visual Management is likely to have specific needs and requirements; however, there are some common implementation characteristics which include:
- Identify your goals:
- Understand operating processes and identify areas where visual Management can be applied and what impact it is likely to have
- Select the appropriate visual indicator to use
- Train your team
- Implement: Start small (perhaps with a pilot project to test your approach), refine and roll out.
- Monitor and measure your progress.
What are the common issues with visual Management, and how can you avoid them
Implementing Visual Management can help enhance efficiency and effectiveness, but there are certain common issues that may arise during implementation; these include:
- Visual Cues are not simple or clear, making information difficult to understand for users.
- Lack of training for users drives poor engagement.
- Access to accurate and timely information to include
- Failure to understand data which leads to incorrect messaging promulgated on visuals
- Failure to sustain when processes or business practices change
- Resistance to change, users do not understand or buy into what is being rolled out, and the effectiveness of visual management is limited.
Summary
Visual Management is an effective methodology for improving efficiency and reducing waste in the workplace.
Through using visual tools and techniques to communicate information and improve understanding of complex situations, businesses can achieve multiple benefits from efficiency, effectiveness, safety and improved collaboration.
Visual Management is not just a technical tool used to communicate information but can also be a crucial social tool, aiding collaboration using social factors that encourage its use.
Effective planning and implementation of visual Management are crucial.
Visual Management can be really easy and simple to deploy (e.g. signs showing hazardous areas) or really hard (e.g. product labelling in heavily legislated industries such as pharmaceuticals)
Too many businesses get swayed by the simplicity of the tool, failing to recognize that any approach needs to be well planned and thought through, taking into account a range of aspects (data, use of medium, intended goal).
Have you implemented visual Management in your workplace? Have some tips for our readers? As ever, we’d love to hear from you; you can reach out to us using Twitter or via the comments section below.